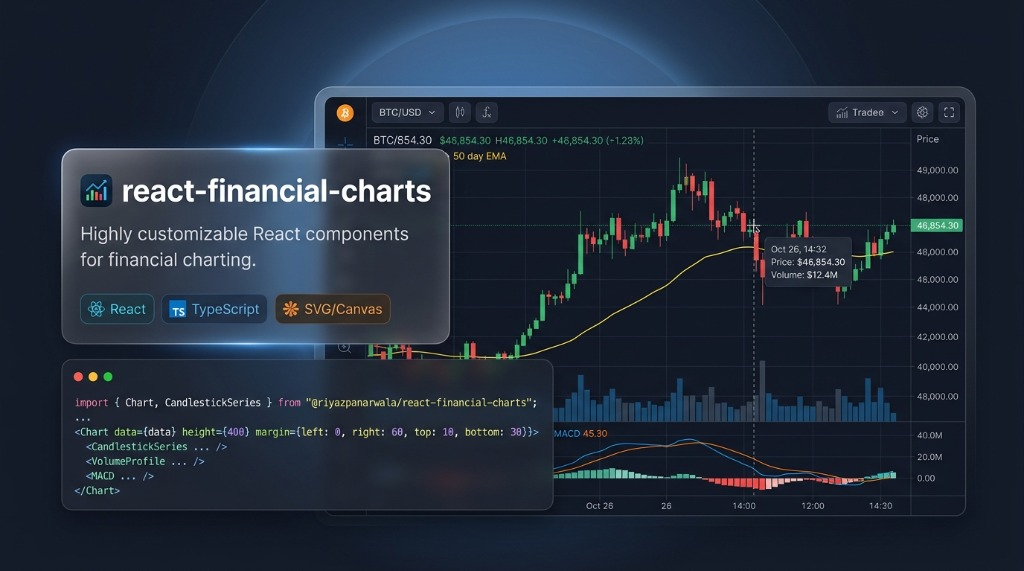
The original react-financial/react-financial-charts repository suffered from outdated React dependencies, broken build scripts, unhandled edge cases in interactive scales, and a lack of support for modern React 18/19 concurrent features. This package resolves those legacy bottlenecks by providing a maintained, fully upgraded NPM release.
React Financial Charts
An upgraded, high-performance open-source React financial charting library featuring latest package upgrades (React 19 support), new features, critical bug fixes, and custom candlestick rendering.
About React Financial Charts
React Financial Charts (@riyazpanarwala/react-financial-charts) is an enhanced, modernized evolution of the popular open-source react-financial/react-financial-charts repository. Rebuilt to address outdated dependencies and unmaintained bugs, this package upgrades the entire dependency ecosystem to the latest versions (including full compatibility with React 19 and Next.js 16), introduces critical bug fixes, adds new technical analysis capabilities, and optimizes canvas/SVG rendering performance for modern stock market dashboards.
Product thinking
Challenge and approach
Maintained and published as an open-source NPM package (@riyazpanarwala/react-financial-charts) from the publish branch on GitHub. It upgrades all legacy peer dependencies of react-financial/react-financial-charts, patches long-standing open issues, and ensures seamless operation in modern React 19 SSR and CSR environments.
Capabilities
Main features
Upgraded all core dependencies, peer dependencies, and build toolchains to the latest versions (React 19 & Next.js 16 compatible)
Enhanced open-source fork of react-financial/react-financial-charts with community bug fixes and stability improvements
Modular React components for candlestick, line, bar, area, volume, and indicator sub-charts
Built-in technical indicator algorithms & visual overlays (SMA, EMA, RSI, MACD, Bollinger Bands, Supertrend, ATR)
Interactive charting utilities: dynamic pan, zoom, touch/mouse crosshairs, tooltips, and price axes
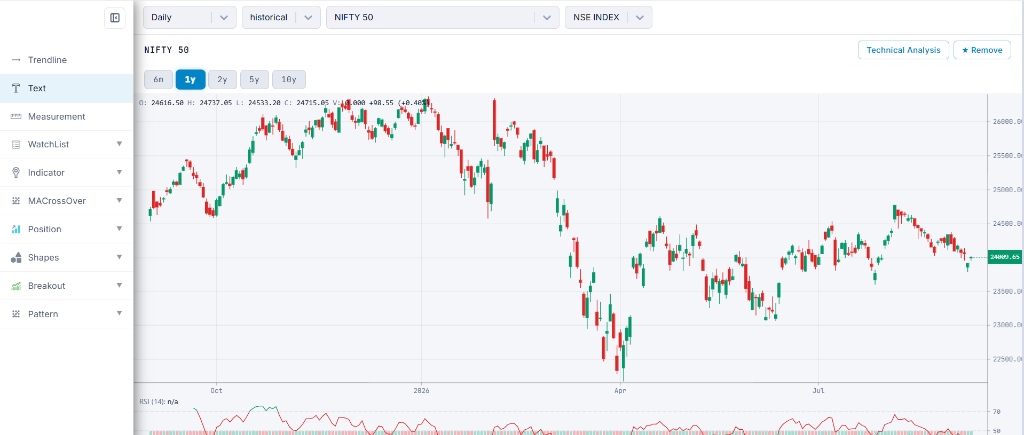
Powers the core charting engine in RCharts (Indian Stock Market Analysis Dashboard)
Architecture
How the system is structured
- 01
Modernized TypeScript build architecture targeting clean ESNext and CommonJS module outputs.
- 02
Upgraded D3 scale, array, and format dependencies for precise coordinate math and financial calculations.
- 03
Optimized canvas and SVG render passes preventing unnecessary re-renders during high-frequency data streams.
- 04
Modular React component hierarchy separating scales, interactive event listeners, and indicator renderers.
Implementation
Technology and data
Technology stack
- React 19
- TypeScript
- NPM Package
- D3 Scales
- Canvas / SVG
- Upgraded Dependencies
- react-financial-charts Fork
Use cases
What the project supports
- Upgrade legacy react-financial-charts implementations to React 19 & Next.js 16 without breaking changes
- Embed interactive candlestick stock & crypto charts with modern React 19 support
- Overlay custom technical indicators and multi-timeframe moving averages on live price feeds
- Build high-performance financial trading terminals, screeners, and market analysis dashboards