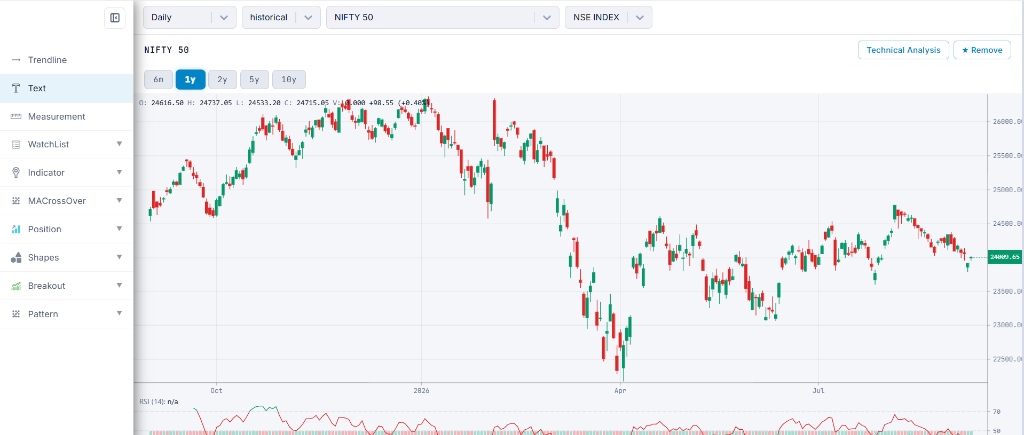
Indian-market technical and fundamental analysis often requires switching between multiple fragmented tools for charting, signal generation, option-chain tracking, financial statements, and watchlist screening. RCharts unifies these workflows into a single high-performance browser interface.
RCharts
A modern, high-performance Indian Stock Market (NSE & BSE) technical analysis dashboard, charting suite, option chain analyzer, and screening tools built with Next.js 16 and React 19.
About RCharts
RCharts (Riyaz Stocks Chart) brings Indian equity charting, technical analysis, market information, option chain analysis, and automated screening utilities into a high-performance Next.js 16 and React 19 dashboard. It supports NSE and BSE equities with custom candlestick rendering, multi-timeframe overlays, pattern recognition, automated technical signal generation, fundamental financial statements, and Playwright stealth data pipelines.
Product thinking
Challenge and approach
The application combines specialized financial charting (@riyazpanarwala/react-financial-charts and Recharts) with custom signal interpretation algorithms, D3 formatting, selection controls, and Next.js API routes. Client and server batch execution models enable fast watchlist technical analysis and structured JSON exports.
Capabilities
Main features
Advanced financial & candlestick charting powered by @riyazpanarwala/react-financial-charts and Recharts with custom candle rendering and multi-timeframe overlays
Comprehensive technical indicators & automated signal interpretation (SMA, EMA, MA crossovers, Supertrend, Chandelier Exit, RSI, MACD, Stochastic, CCI, Williams %R, ROC, Bollinger Bands, ADX/DMI, ATR)
Automatic chart pattern detection, trendline breakout scanning, and custom chart annotations
Interactive Option Chain dashboard for NSE indices (NIFTY, BANKNIFTY, FINNIFTY) and stock options with Open Interest (OI) analysis
Stock Screener & Batch Analysis engine for multi-indicator technical analysis across custom watchlists with JSON data export
Detailed company fundamentals including P&L statements, balance sheets, cash flow, valuation ratios, and NSE financial APIs
Trading utilities & position calculators for long/short size management, risk-reward ratios, and angle calculation
Automated data pipeline scripts for NSE equities, BSE equities (via Playwright stealth), ETF security lists, and F&O lot sizes
Embedded TradingView & Forex widgets with dynamic dark/light mode and virtualized table rendering
Architecture
How the system is structured
- 01
Next.js 16 (App Router) routes organize analytical pages, market utility views, and dynamic metadata.
- 02
React 19 component hierarchy with Framer Motion micro-animations and React Window table virtualization.
- 03
Automated Playwright stealth scraping pipeline for autonomous data collection from NSE, BSE, ETF, and F&O lot size feeds.
- 04
Data integration layer utilizing yahoo-finance2, stock-nse-india, and @zero65tech/indian-stock-market endpoints alongside repository CSV datasets.
Implementation
Technology and data
Technology stack
- Next.js 16
- React 19
- React Financial Charts
- Recharts
- Sass
- Framer Motion
- Playwright Stealth
- Yahoo Finance API
- D3 Format
- React Window
Data sources
- Yahoo Finance API (yahoo-finance2)
- NSE & BSE Market APIs (stock-nse-india, @zero65tech/indian-stock-market)
- Playwright Stealth Data Scraper Pipeline
- Repository CSV Datasets
Engineering details
Technical considerations
OperationsDeployment considerations
- Requires Node.js 24+ and builds as a standard Next.js 16 App Router web application.
- Includes Playwright stealth automation scripts for scheduled data scraping and dataset updates.
Use cases
What the project supports
- Perform multi-timeframe Indian equity technical analysis with automated Bullish / Bearish / Neutral signal interpretations
- Scan stock watchlists using multi-indicator batch screens and export analysis to JSON
- Analyze NSE index and stock option chains with Open Interest (OI) analytics
- Evaluate company fundamentals, P&L, balance sheets, and key valuation metrics
- Calculate position sizing, risk-reward ratios, and chart angles on mobile and desktop