Environmental DataLive

AQI India Live

A bilingual India-focused air-quality app with live AQI, nearest monitoring stations, pollutant and weather details, forecasts, and saved cities.

PlatformExpo app for Android, iOS, and web
RoleCross-platform engineering
Tech Stack5 Technologies
Capabilities8 Modules
AQI India LiveReady
India AQI Live air quality tracking, pollution levels, and station forecasts
Project Overview

About AQI India Live

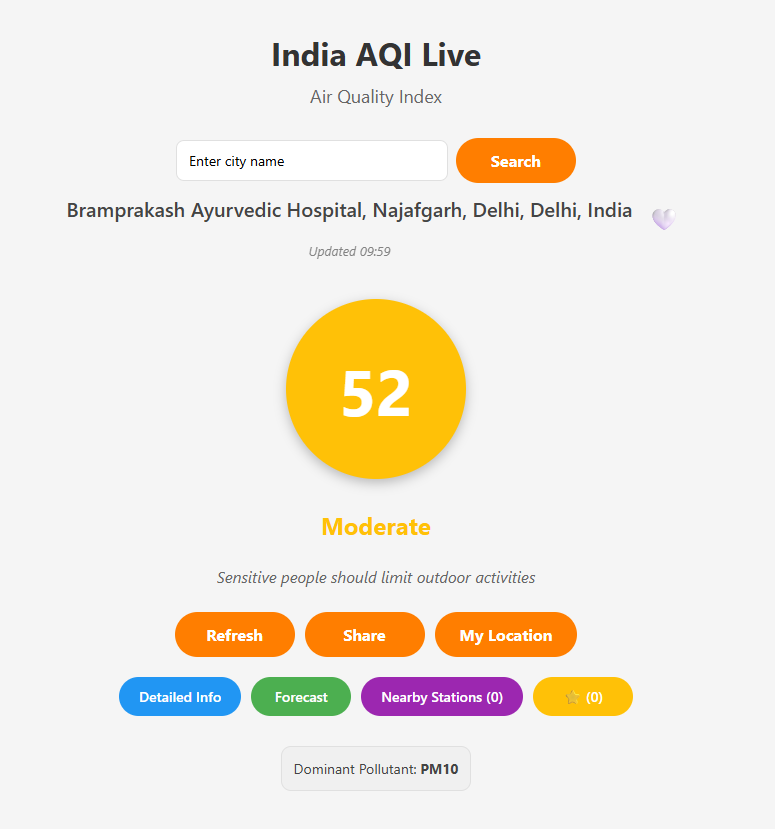
AQI India Live is an Android, iOS, and web application focused on Indian air-quality conditions, including rural areas. It uses more than 500 WAQI monitoring stations to show the nearest available reading, station distance, health guidance, detailed pollutants, weather context, and forecast information.

Product thinking

Challenge and approach

The Challenge

Air-quality information is most useful when people can quickly find a nearby measurement and understand what the number means. The application combines device location, nearest-station discovery, color-coded AQI status, health advice, pollutants, and weather into one cross-platform view.

The Solution & Approach

The interface maps numeric AQI readings to a color-coded status and health guidance, combines station observations with pollutant and weather fields, and ranks nearby monitoring stations by distance. React Native Chart Kit presents forecast information across the supported platforms.

Capabilities

Key capabilities & features

01

Real-time AQI from more than 500 WAQI monitoring stations

02

Nearest 20 stations with distance and current-location marker

03

Color-coded AQI status with health advice

04

PM2.5, PM10, NO₂, CO, O₃, and SO₂ breakdowns

05

Temperature, humidity, wind, and pressure information

06

Seven-day PM2.5 and PM10 forecast

07

Unlimited favorite cities, sharing, and pull-to-refresh

08

Hindi and English support across Android, iOS, and web

Architecture

System structure & pipeline

Step 1

React Native and Expo provide one application codebase for Android, iOS, and web.

Step 2

The WAQI API supplies station, AQI, pollutant, forecast, and related weather data.

Step 3

Device location is used to identify nearby stations and calculate their distance.

Step 4

AsyncStorage keeps favorite locations on the user's device.

Implementation

Technology and data pipeline

Technology stack

  • React Native
  • Expo
  • EAS Build
  • AsyncStorage
  • React Native Chart Kit

Data sources & APIs

  • WAQI air-quality and monitoring-station API
  • Device location

Engineering details

Technical considerations

PrivacyData and privacy
  • The application requires no user account or login.
  • Favorite cities are stored locally with AsyncStorage.
  • The project states that the application contains no advertising or user tracking.

Use cases

What the project supports

  • Check air quality near the current location
  • Compare nearby monitoring stations and their distance
  • Review individual pollutant and weather readings
  • Follow PM2.5 and PM10 forecast conditions
  • Save and share frequently checked cities

Continue exploring

↗

Financial Tool

Web application

RCharts

A modern, high-performance Indian Stock Market (NSE & BSE) technical analysis dashboard, charting suite, option chain analyzer, and screening tools built with Next.js 16 and React 19.

Live Demo →
  • Next.js 16
  • React 19
  • +8
↗

Workflow Website

Web application

Panarwala & Associates

A responsive professional-services website that organizes tax consulting, preparation, and advisory information through reusable, accessible service pages.

Live Demo →
  • React
  • CSS custom properties
  • +1
↗

Financial Tool

Excel-based web dashboard

PortFin - Excel portfolio dashboard

A no-backend investment dashboard that turns mutual-fund and stock Excel files into portfolio analytics, planning tools, tax views, and action signals.

Live Demo →
  • HTML5
  • CSS3
  • +4